Worldwide, outdoor (ambient) air quality is a serious threat to health, estimated to cause millions of premature deaths due to cardiorespiratory diseases and lung cancer. Affected regions include both urban and rural areas. In 2016, the majority of the world population was living in areas in which maximum concentration of air pollutants were not met (1). In what concerns to sources, anthropogenic factors are the most relevant to negative effects of ambient polluted air (2).
Since 2013, the International Agency for Research on Cancer has defined polluted ambient air and particulate matter (PM) (separately) as carcinogenic to humans (group 1). In addition to strong evidence that polluted air cause lung cancer, there is also an increased risk of bladder cancer. Despite local variations, these conclusions are valid globally (3).
It is expected that in 2050, two-thirds of world population will be living in cities. By converging all opportunities and services in one area, overpopulated cities are also a challenge in terms of health risks and hazards. Creating and transforming sustainable cities implies intersectoral work, particularly governors and policymakers. In order to monitor and recognise success, World Health Organization (WHO) developed core health indicators for different sectors, including one in urban air quality. The indicator evaluates annual average of 2.5 and 10 concentrations in relation with WHO air-quality guidelines (4).
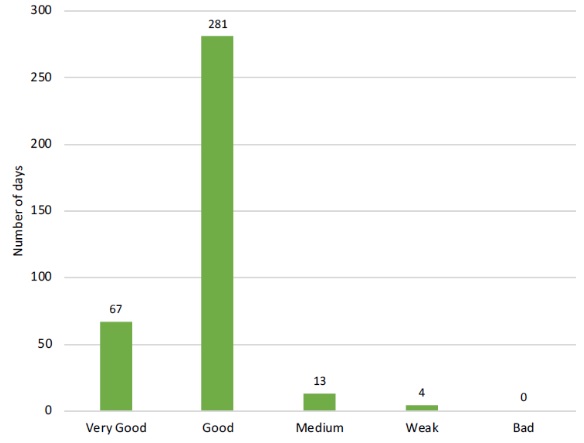
In 2016, Portugal had 91,3% of days classified as very good/good in terms of air quality index (IQAr) by the Portuguese Environment Agency. In the same year, Porto Litoral (coast) had 95,3% days with the same classification (Figure 1) (5). This index includes measures on five air polluted substances such as PM, ozone (O3), nitrogen dioxide (NO2), sulfur dioxide (SO2) and carbon monoxide (CO) (6).
Data on polluted air concentrations of 2.5 is provided by the WHO Global Observatory, including data on 190 countries. The Portuguese 2016 annual mean concentration of 2.5 was 8,1 µg/3, meeting WHO guidelines of lower than 10 µg/3 (7) (8). In the same year, the annual mean concentration of 2.5 (204 days of validated data) was 2.9 µg/3 in Porto (Sobreiras – Lordelo do Ouro station) (9). Data on both country and city levels of 10 was not available in the same sources. While Porto results are suitable so far, the predictions of research data using modelling methods are not optimistic. Even if precursor emissions and population remain constant, Porto will be the district most affected concerning 10 high concentration days and related health impact in 2100 (10).
Though in 2016, Portugal and Porto results on 2.5 met WHO guidelines, climate change and inaction specially on anthropogenic factors will be responsible for worse scenarios with serious consequences to human health.
_________________________
References
- World Health Organization. Ambient (outdoor) air quality and health [Internet]. Fact sheets. 2018. Available from: http://www.who.int/news-room/factsheets/detail/ambient-(outdoor)-air-quality-and-health
- World Health Organization. Ambient air pollution: Pollutants. Air Pollution; Available from: http://www.who.int/airpollution/ambient/pollutants/en/)
- World Health Organization. IARC: Outdoor air pollution a leading environmental cause of cancer deaths; Available from: http://www.iarc.fr/en/mediacentre/iarcnews/pdf/pr221_E.pdf
- World Health Organization. Health Indicators of sustainable cities in the Context of the Rio+20 UN Conference on Sustainable Develpment. 2012; Available from: http://www.who.int/hia/green_economy/indicators_cities.pdf?ua=1
- Fernandes AC, Guerra MD, Ribeiro R, Rodrigues S. Relatório do Estado do Ambiente 2018. Agência Port do Ambient. 2018; Available from: https://sniambgeoviewer.apambiente.pt/GeoDocs/geoportaldocs/rea/REA2018/REA2018.pdf
- Portuguese Environment Agency. Air quality; Available from: (https://qualar.apambiente.pt/qualar/index.php?page=5&subpage=6).
- World Health Organization. Concentrations of fine particulate matter (PM2.5); Available from: http://apps.who.int/gho/data/node.sdg.11-6-viz?lang=en
- Lodgejr J. Air quality guidelines. Global update 2005. Particulate matter, ozone, nitrogen dioxide and sulfur dioxide. Environ Sci Pollut Res. 1996; Available from: http://apps.who.int/iris/bitstream/handle/10665/69477/WHO_SDE_PHE_OEH_06.02_eng.pdf?sequence=1
- Portuguese Environment Agency. Station statistics; Available from: https://qualar.apambiente.pt/qualar/index.php?page=4&subpage=4).
- Dias D, Tchepel O, Carvalho A, Miranda AI, Borrego C. Particulate matter and health risk under a changing climate: Assessment for Portugal. Sci World J. 2012; Available from: https://www.ncbi.nlm.nih.gov/pmc/articles/PMC3361258/)
_________________________
Mariana Perez Duque
Public Health Resident
Public Health Unit ACeS Porto Ocidental, ARS Norte, Portugal